Breast Cancer Integrative Platform (BCIP) is a website for the analyses and visualizations of genes from patients with breast cancer. Owing to the significant difference in malignancy, tumor invasion and prognosis of same carcinoma, researchers need to formulate personalized preventive and therapeutic measures to deal with tumor heterogeneity between diverse patients. Thus we constructed the BCIP, and it is designed to explore heterogeneous manifestations of genes between different subgroups.
The data of our platform are derived from publicly published databases consist of the European Bioinformatics Institute of European Molecular Biology Laboratory(EMBL-EBI), The Cancer Genome Atlas (TCGA), and Gene Expression Omnibus (GEO) dataset of NCBI. It is characterized by multi-omics integrated analysis types (transcriptome, copy number variation, microRNA, pathway and gene functional network analysis), and dividing the breast cancer samples into several subgroups according to histopathological features and clinical information. Both the analysis types and sample subgrouping methods provide much better insights into the biological, molecular, and pathologic influences on various breast cancer subgroups so as to make a difference for identification of candidate regulatory genes or biomarkers.
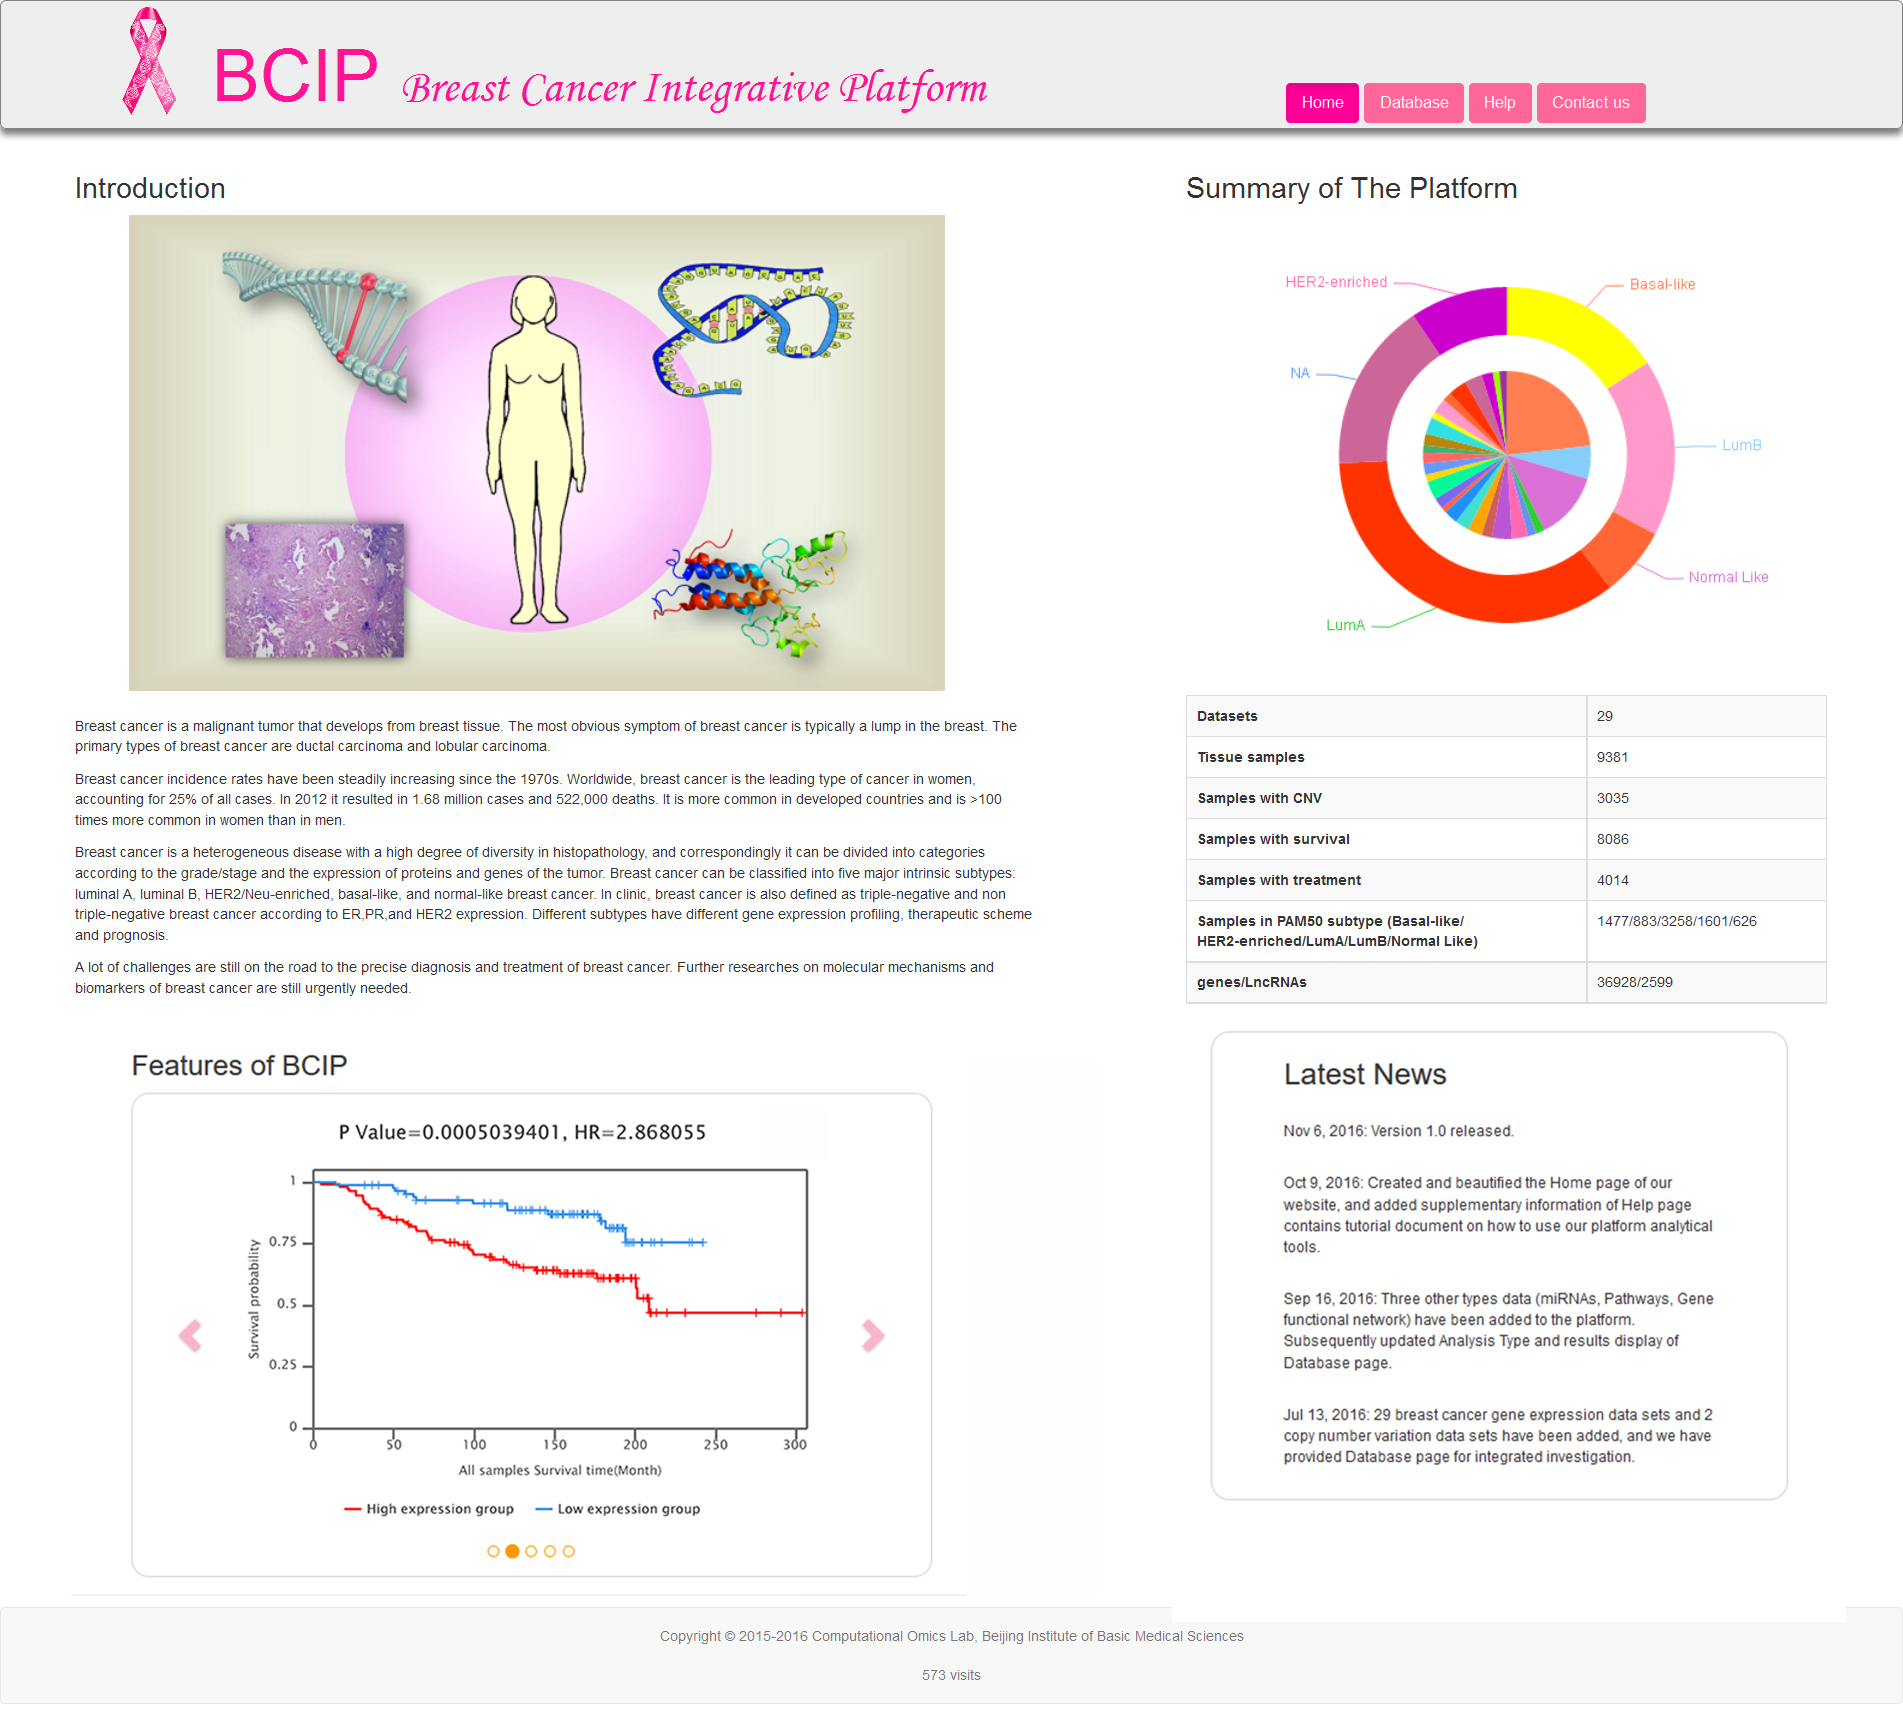
The Home page (Fig.1) provides four parts (Introduction, Summary of The Platform, Features of BCIP, Latest News). The core views offered by Home page are Summary of The Platform and Features of BCIP. The pie chart in Summary of The Platform exhibit the summary of 29 datasets used in BCIP and the samples proportion of each dataset. The images in Features of BCIP circularly display some analysis results of Database page.
There are four tabs at the navigation bar and each tab provides the access of corresponding page. To get started, click the Database tab and this will take you to the Database page where you can implement your gene-based analyses and view results. Database page (Fig.2) is consists of three content panes show below:
Gene query column: input a gene name, select analysis types and sample subgrouping strategies;
Dataset column: display datasets which are conform to the above condition user selected.
Result column: click one of the datasets from dataset column and then visualize the corresponding results.
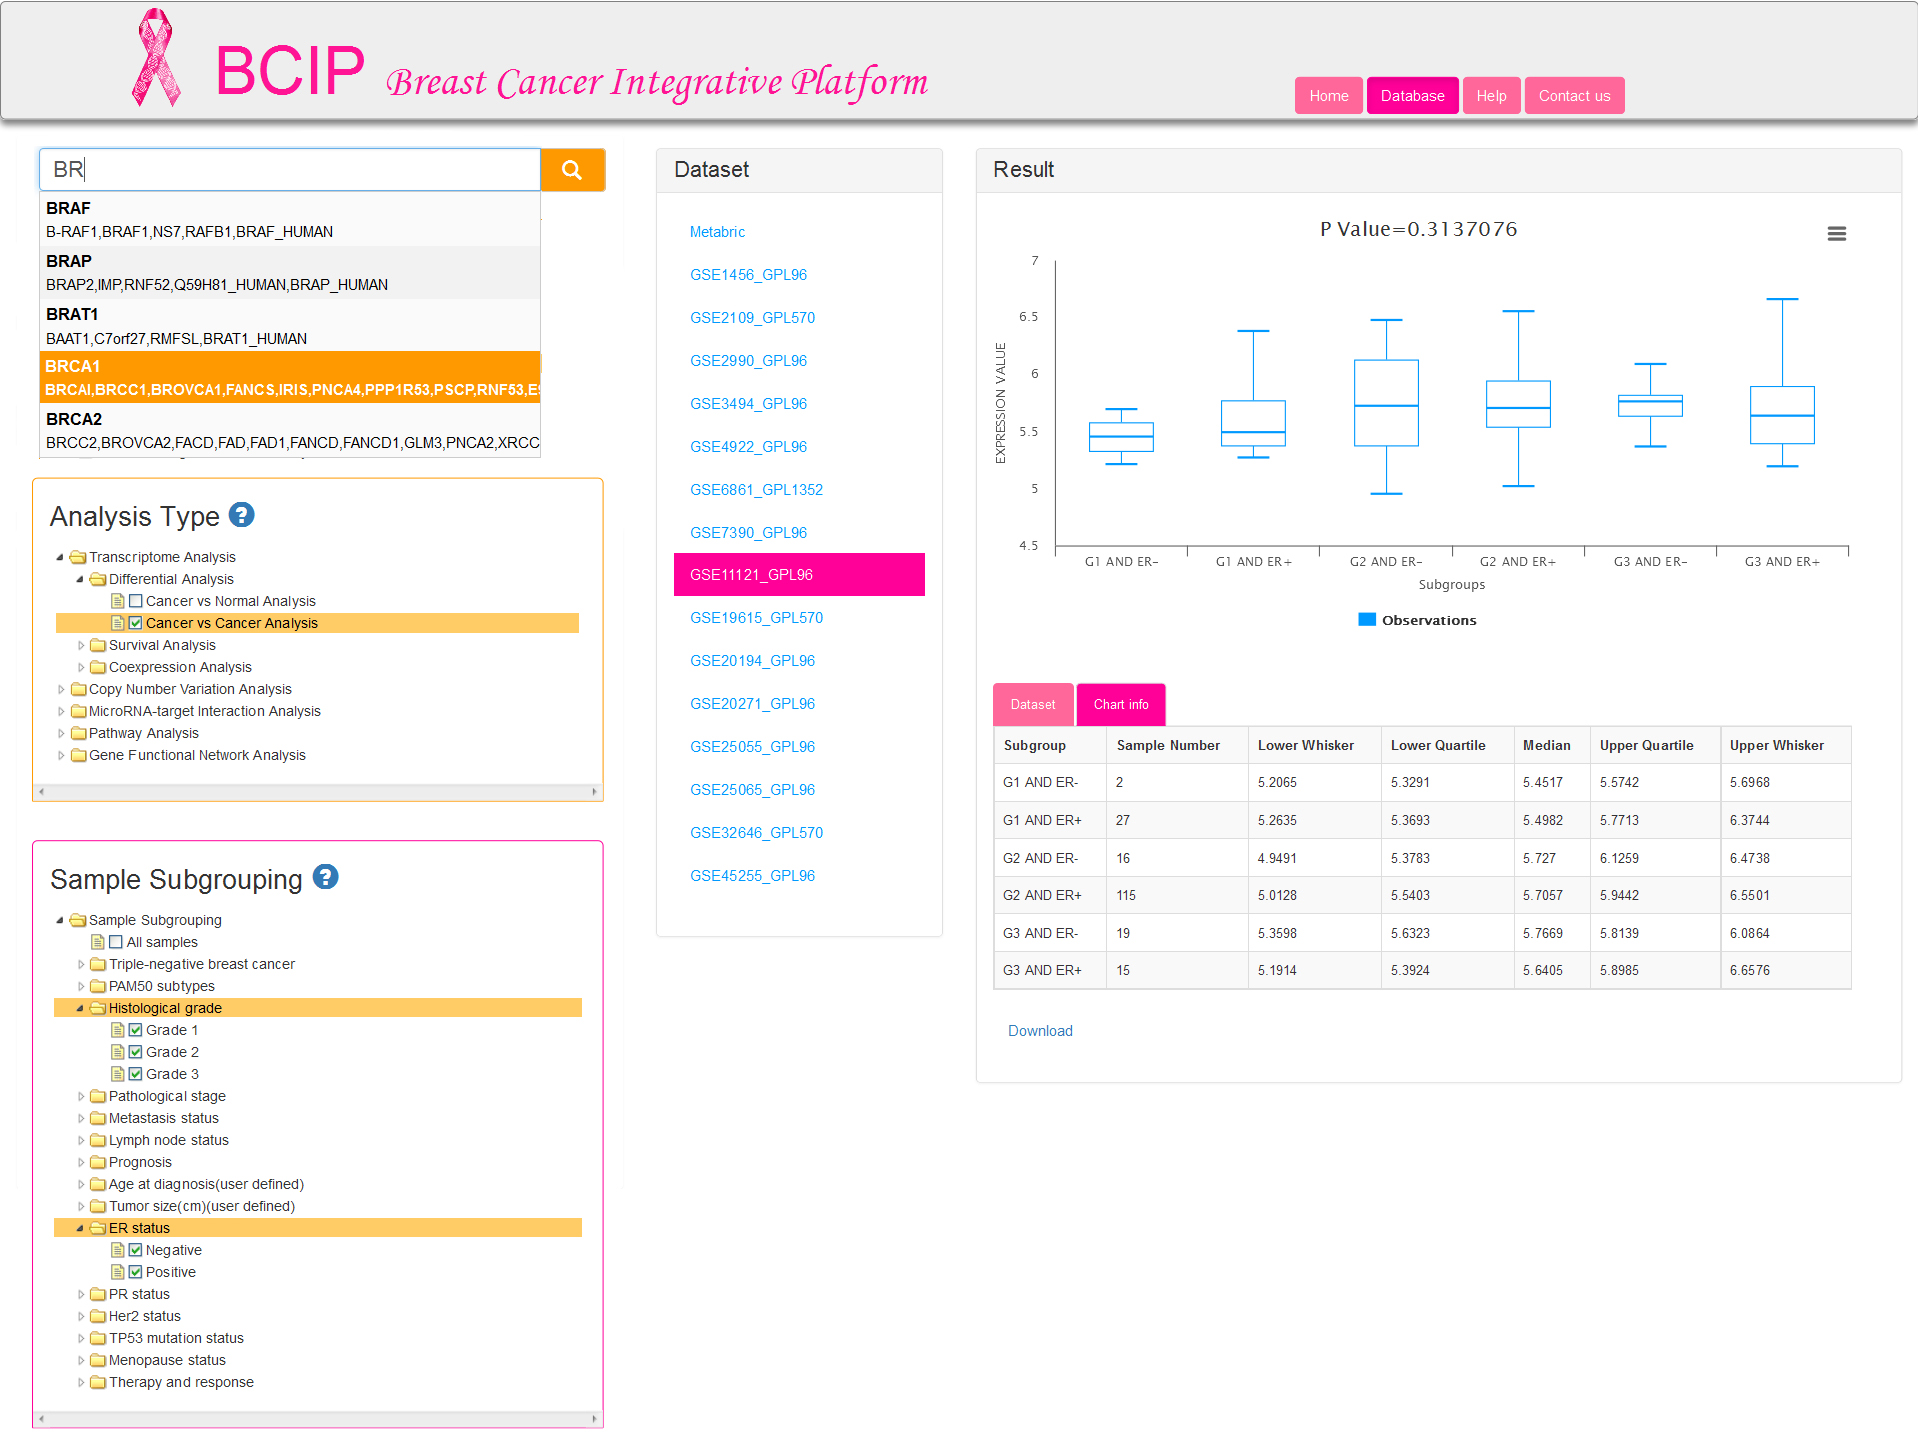
If you are engaged in breast cancer related research and have a series of genes which are required to be understood more completely and precisely, then BCIP will provide the opportunity to obtain information as comprehensive as possible on multiple levels in breast cancer. Here are the analysis processes (Fig.2) you should carry out:
Step 1: Input your query gene (only one gene each time). We provide fuzzy matching for input gene name (gene symbol) or gene synonym.
Tip: Auto-complete displays up to 5 results at a time. If you do not initially see a result that you expected, type additional characters into the Search box; the auto-complete dropdown will update dynamically.
Step 2: Select one analysis type that you are interested in. Five major analyses are offered in BCIP database: Transcriptome Analysis, Copy Number Variation Analysis, MicroRNAs Analysis, Pathway Analysis, Gene Functional Network Analysis. Both the first two analysis types provide differential expression analysis and survival analysis. Coexpression analysis is available in transcriptome analysis alone.
Step 3: Select one or more subgrouping options to divide the samples into several groups, and then submit your selection to filter datasets which are conformance to requirements. Analysis results from computations are performed on samples within a dataset. User selection of subgrouping options are not supported for the last three analysis types (MicroRNAs, Pathway and Gene Functional Network Analysis), which are provided default option of all samples from a corresponding dataset. The first two analyses (Transcriptome and Copy Number Variation Analysis) allow users to select at most 2 groups in entire 15 groups. It is permitted to choose one or more options in each group selected by users for differential analysis (Fig.2a), but only one option in each group is allowed for survival analysis and coexpression analysis (Fig.2b).
BCIP datasets are composed of samples represented as microarray data or high-throughput sequencing data measuring either mRNA expression or DNA copy number on primary tumors and adjacent normal samples. There are three categories in transcriptome analysis: differential analysis, survival analysis and coexpression analysis.
If you select cancer vs normal Analysis, we first filter the datasets which include both tumor and adjacent normal samples. Then you can perform the step 3 mentioned above. Notably, sample subgrouping option is set to All samples (meant all tumor and adjacent normal samples) by default (Fig.3a) for current analysis type. It is allowed to change the default option (Fig.3b), and select 2 groups at most (allow choose more than one in each group) so that you can produce several subgroups. Thus you will get the result which shows the difference between the tumor and adjacent normal tissues from breast cancer patients in each subgroup.
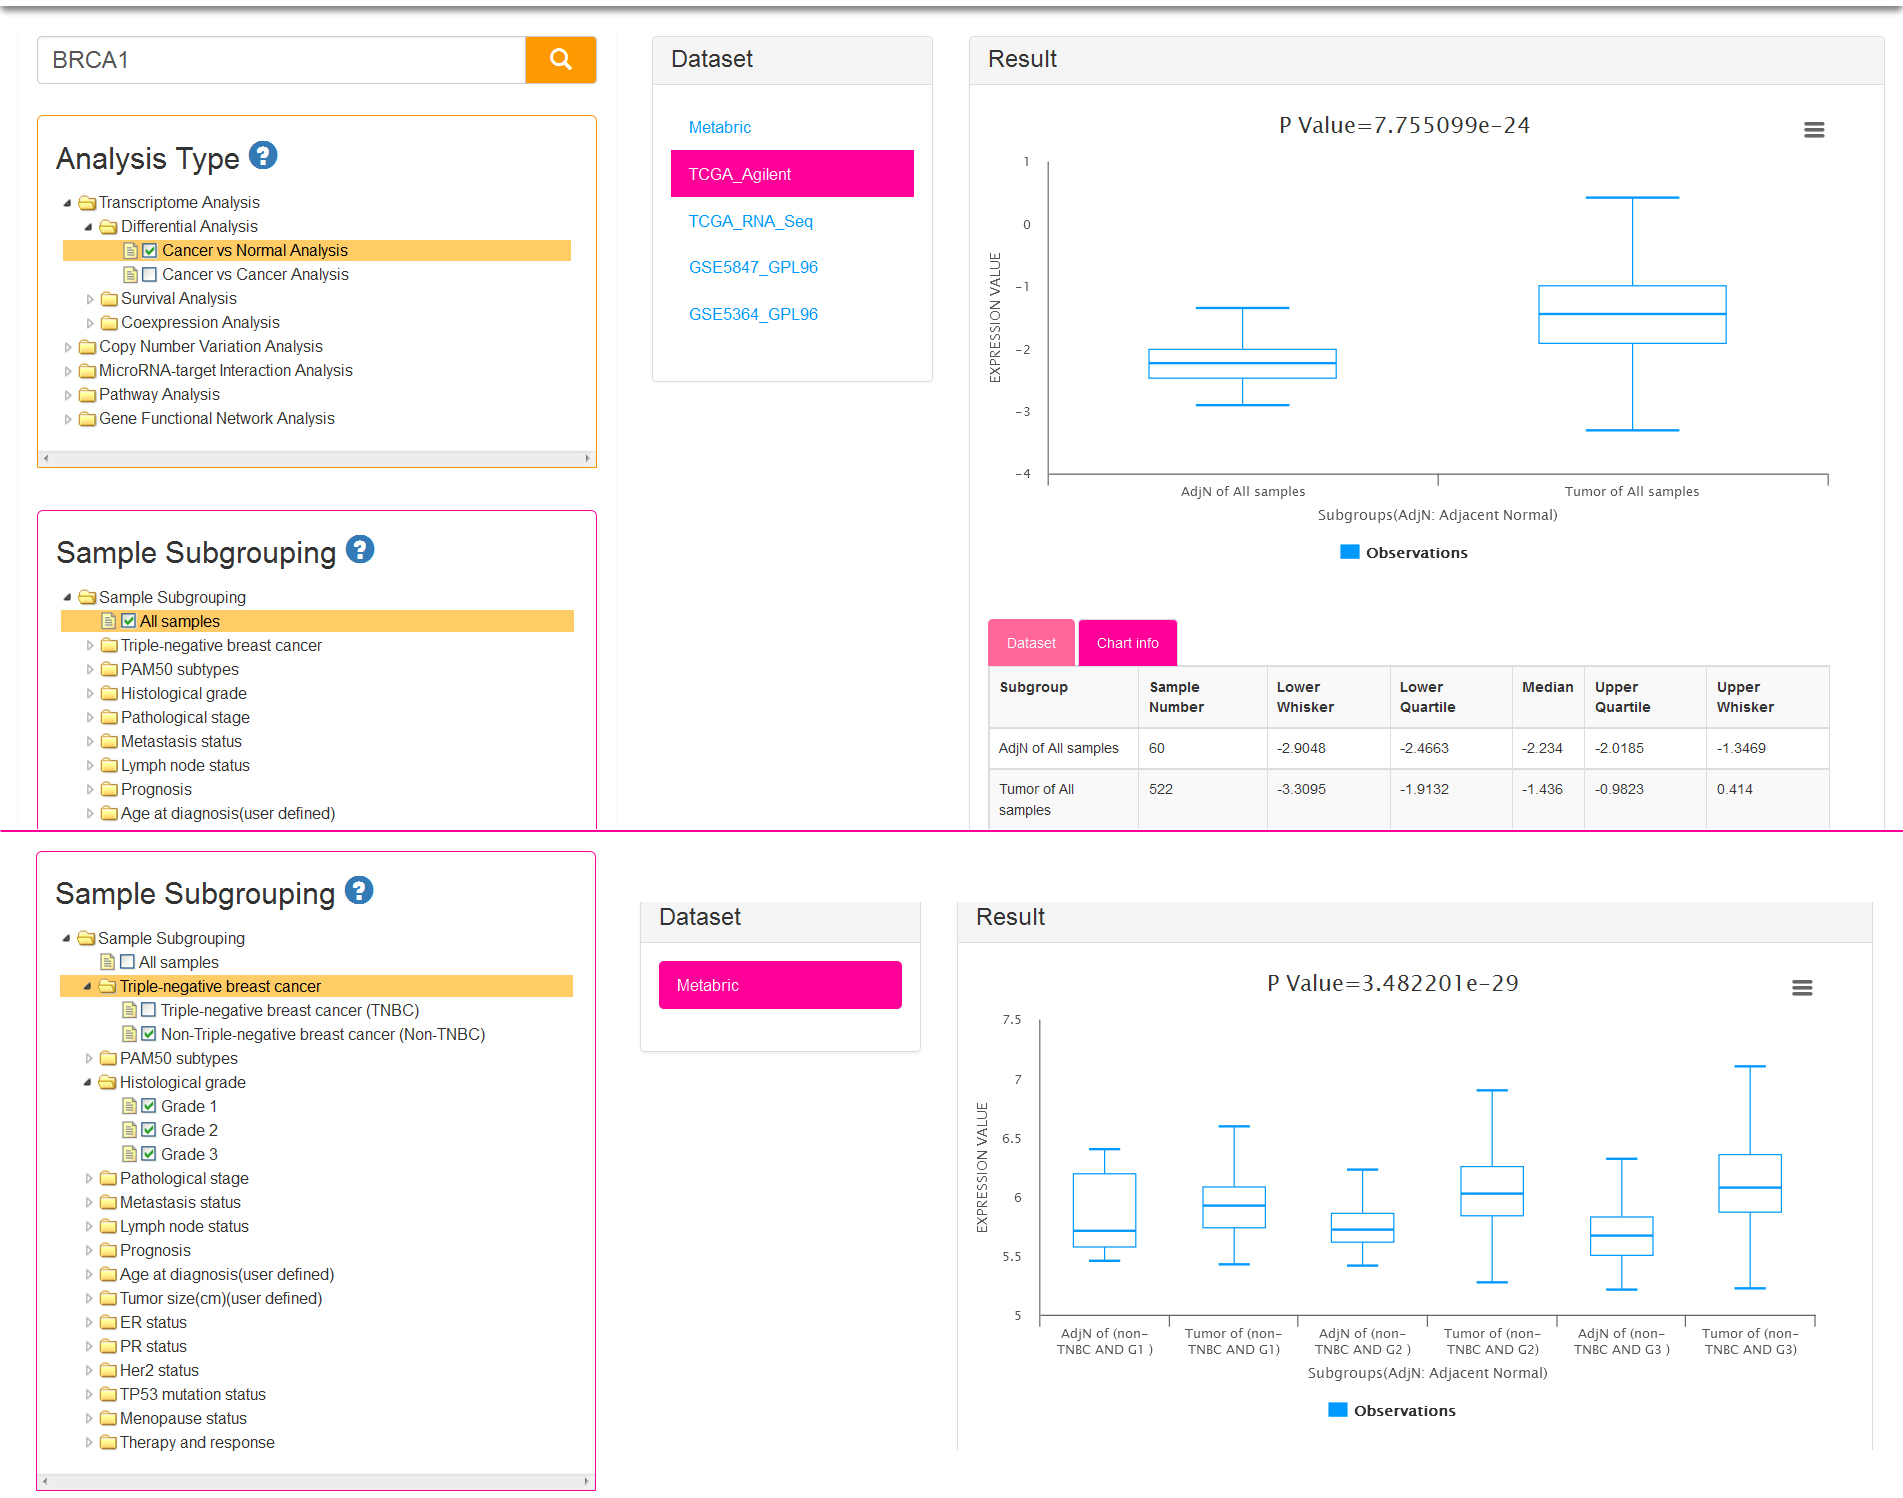
There are two parts in result view: gene expression boxplots and data information tables. The vertical axis of the chart represents gene expression value and the abscissa axis represents different combinational groups. For example, if you select cancer vs normal analysis and All samples of subgrouping option (Fig.3a), the samples will be divided into two subgroups: AdjN of All samples, Tumor of All samples (AdjN: Adjacent Normal). If you check off LumA in PAM50 subtypes and Grade 1/Grade 2 in Histological grades (Fig.3b), then the samples will be divided into four subgroups: Tumor of (LumA AND G1), AdjN of (LumA AND G1), Tumor of (LumA AND G2), AdjN of (LumA AND G2). The last two subgroups respectively mean which contains the tumor samples or adjacent normal samples that belong to the intersection set of LumA subtype and Grade 2 breast cancer patients. The tables display the detail information of the current dataset and each subgroup of the chart.
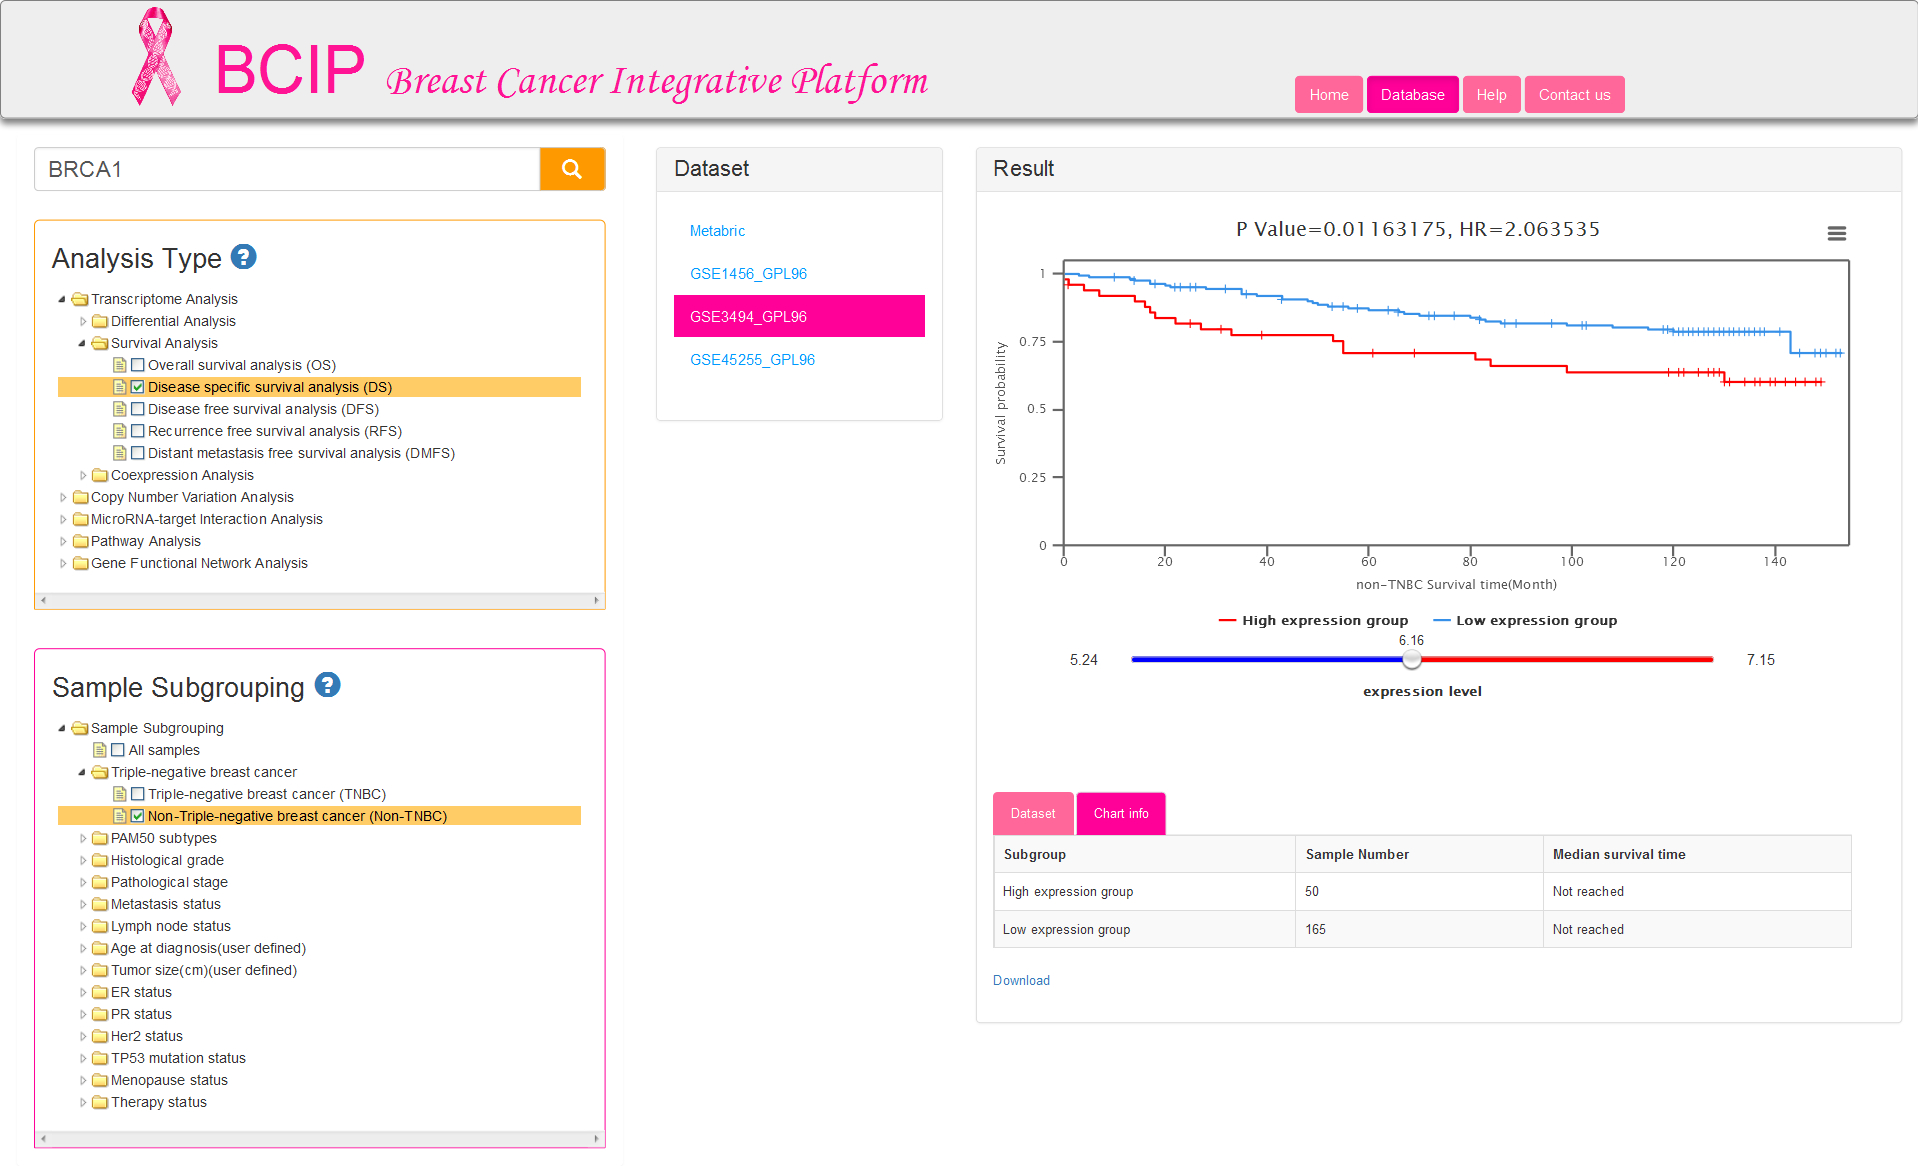
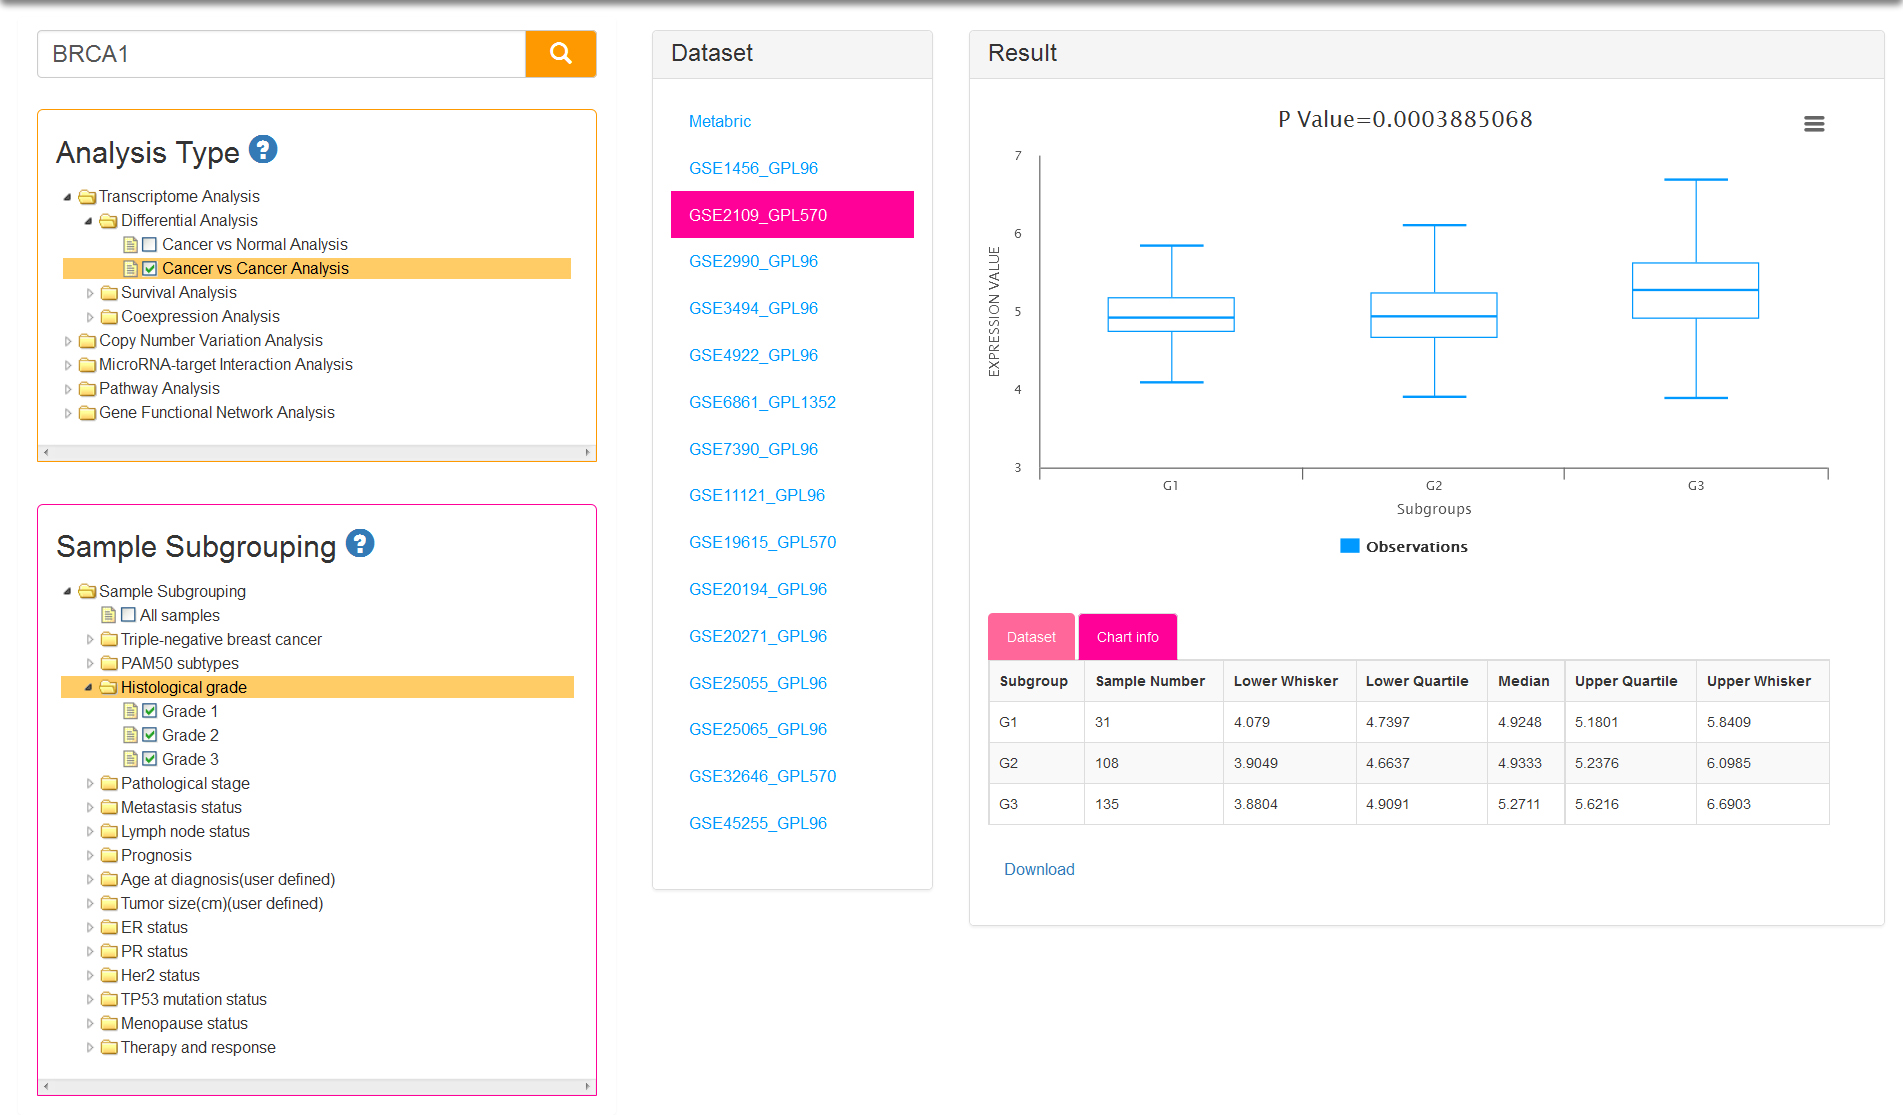
If you select cancer vs cancer analysis, normal samples are excluded. At least two groups are needed for differential analysis and therefore sample subgrouping option is set to TNBC and non-TNBC (Fig.4) by default. You can also remove the default option and reselect. Undoubtedly, option of All samples is not permitted to check off.
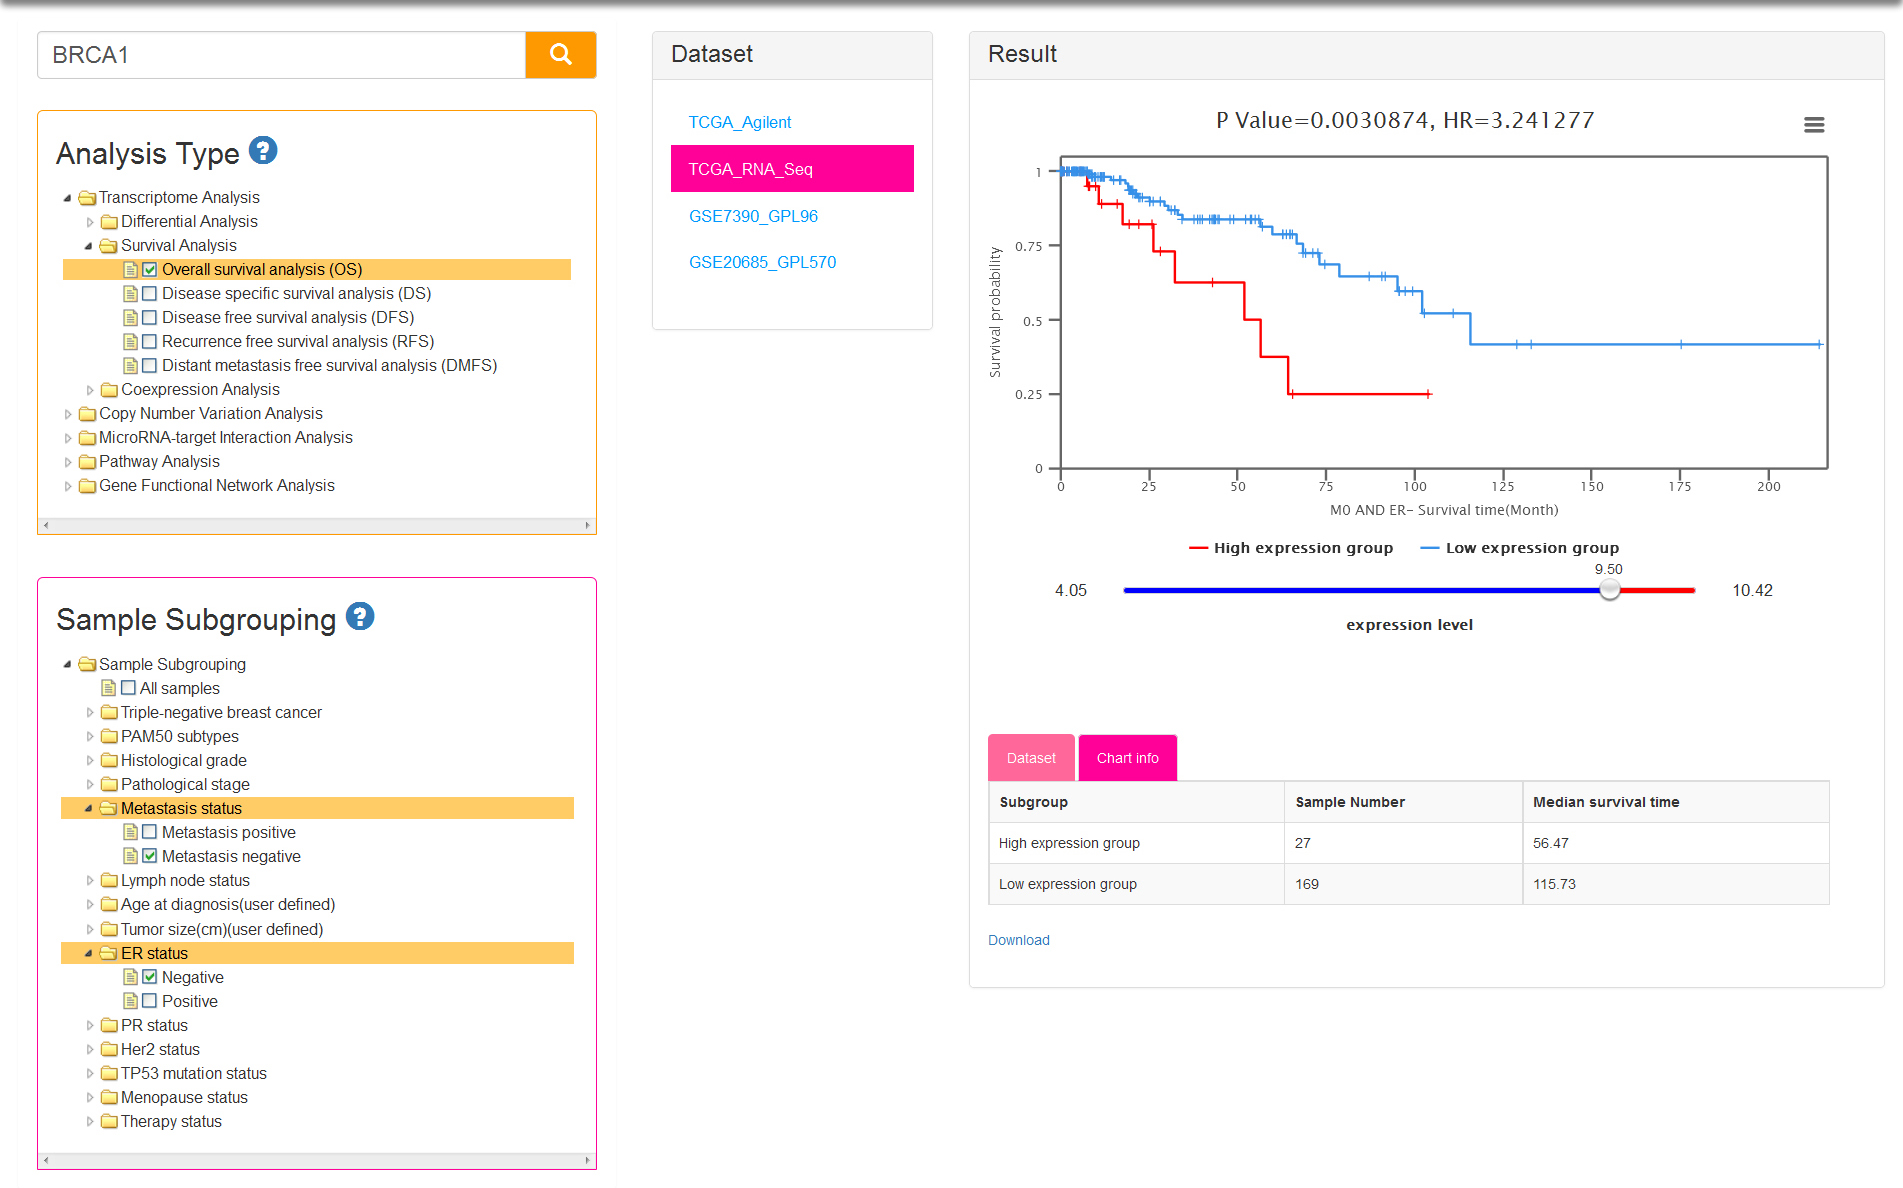
There are five kinds of survival time information and correspondingly five analysis types: OS/DS/DFS/RFS/DMFS. Sample subgrouping option is set to All samples by default. You can change the option and reselect any 2 groups at most. Notably, only one option in each group is allowed to select in survival analysis (Fig.5). The tables of result visualization are similar with differential analysis. The survival curves respectively display the low and high expression group which is separated by the optimal cutoff gene expression value. The optimal cutoff value, represented by the number of the initial point on slider bar, is defined as the expression value to obtain minimum P value for the two survival curves.
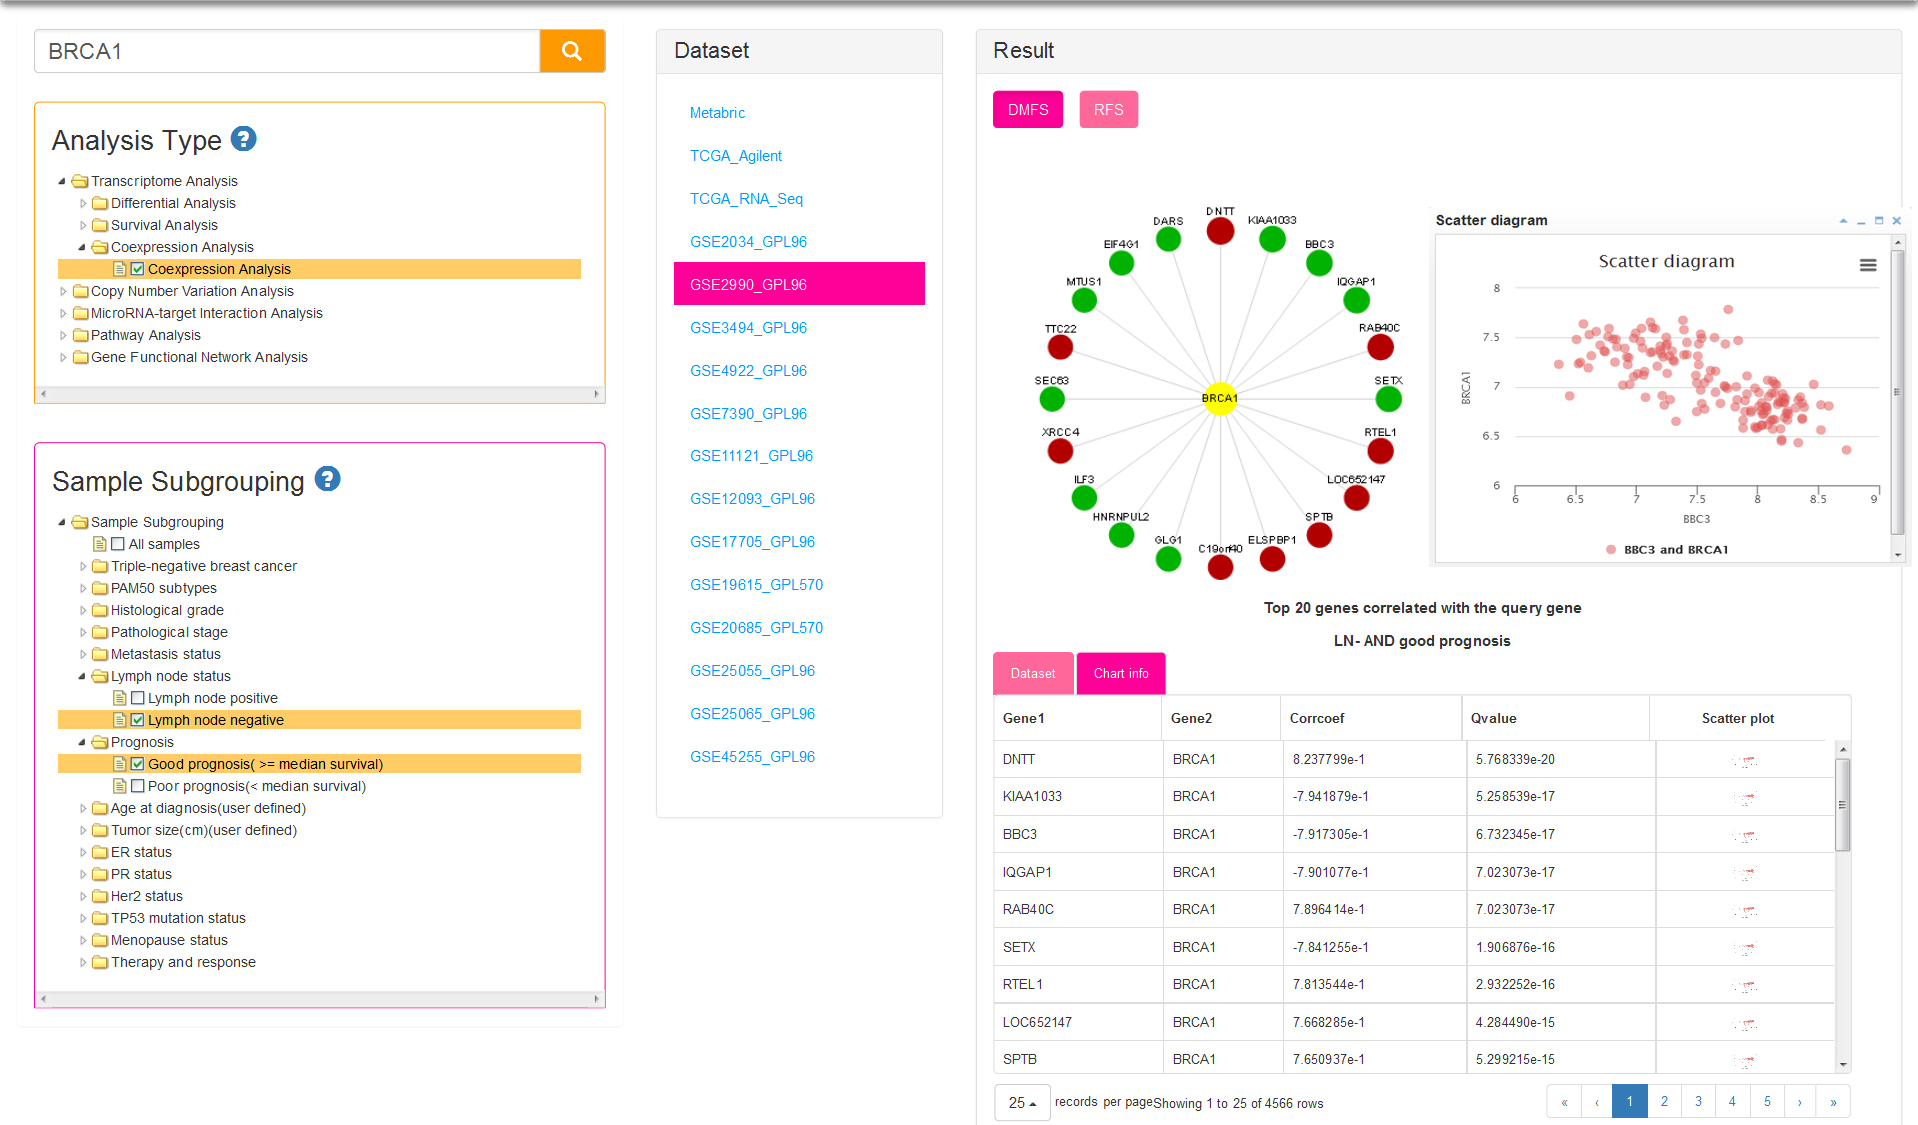
Coexpression indicates that genes are similarly expressed to query gene in certain subgroup samples within a dataset. Similarity between genes is represented by Pearson correlation coefficient and adjusted p-value. Sample subgrouping method (Fig.6) for current analysis is same with survival analysis. The result of circle dot show the top 20 genes correlated with the query gene. Positive and negative correlation is distinguished by red and green circle respectively. You can click on a gene name to view the scatter plot of gene expression. Table result lists genes which meet the conditions that correlation coefficient > 0.3 and adjusted p value < 0.05.
NOTE:Not all groups of sample subgrouping are the same for different analysis types. Group of Therapy status is only provided for survival analysis, and group of Prognosis, Therapy and Response are for differential analysis and coexpression analysis.
Age at diagnosis (user defined) and Tumor size (cm)(user defined) groups are different from others for editing characteristic. If you want to select the two subgroups, then you can redefine the value of age or tumor size by clicking on the number.
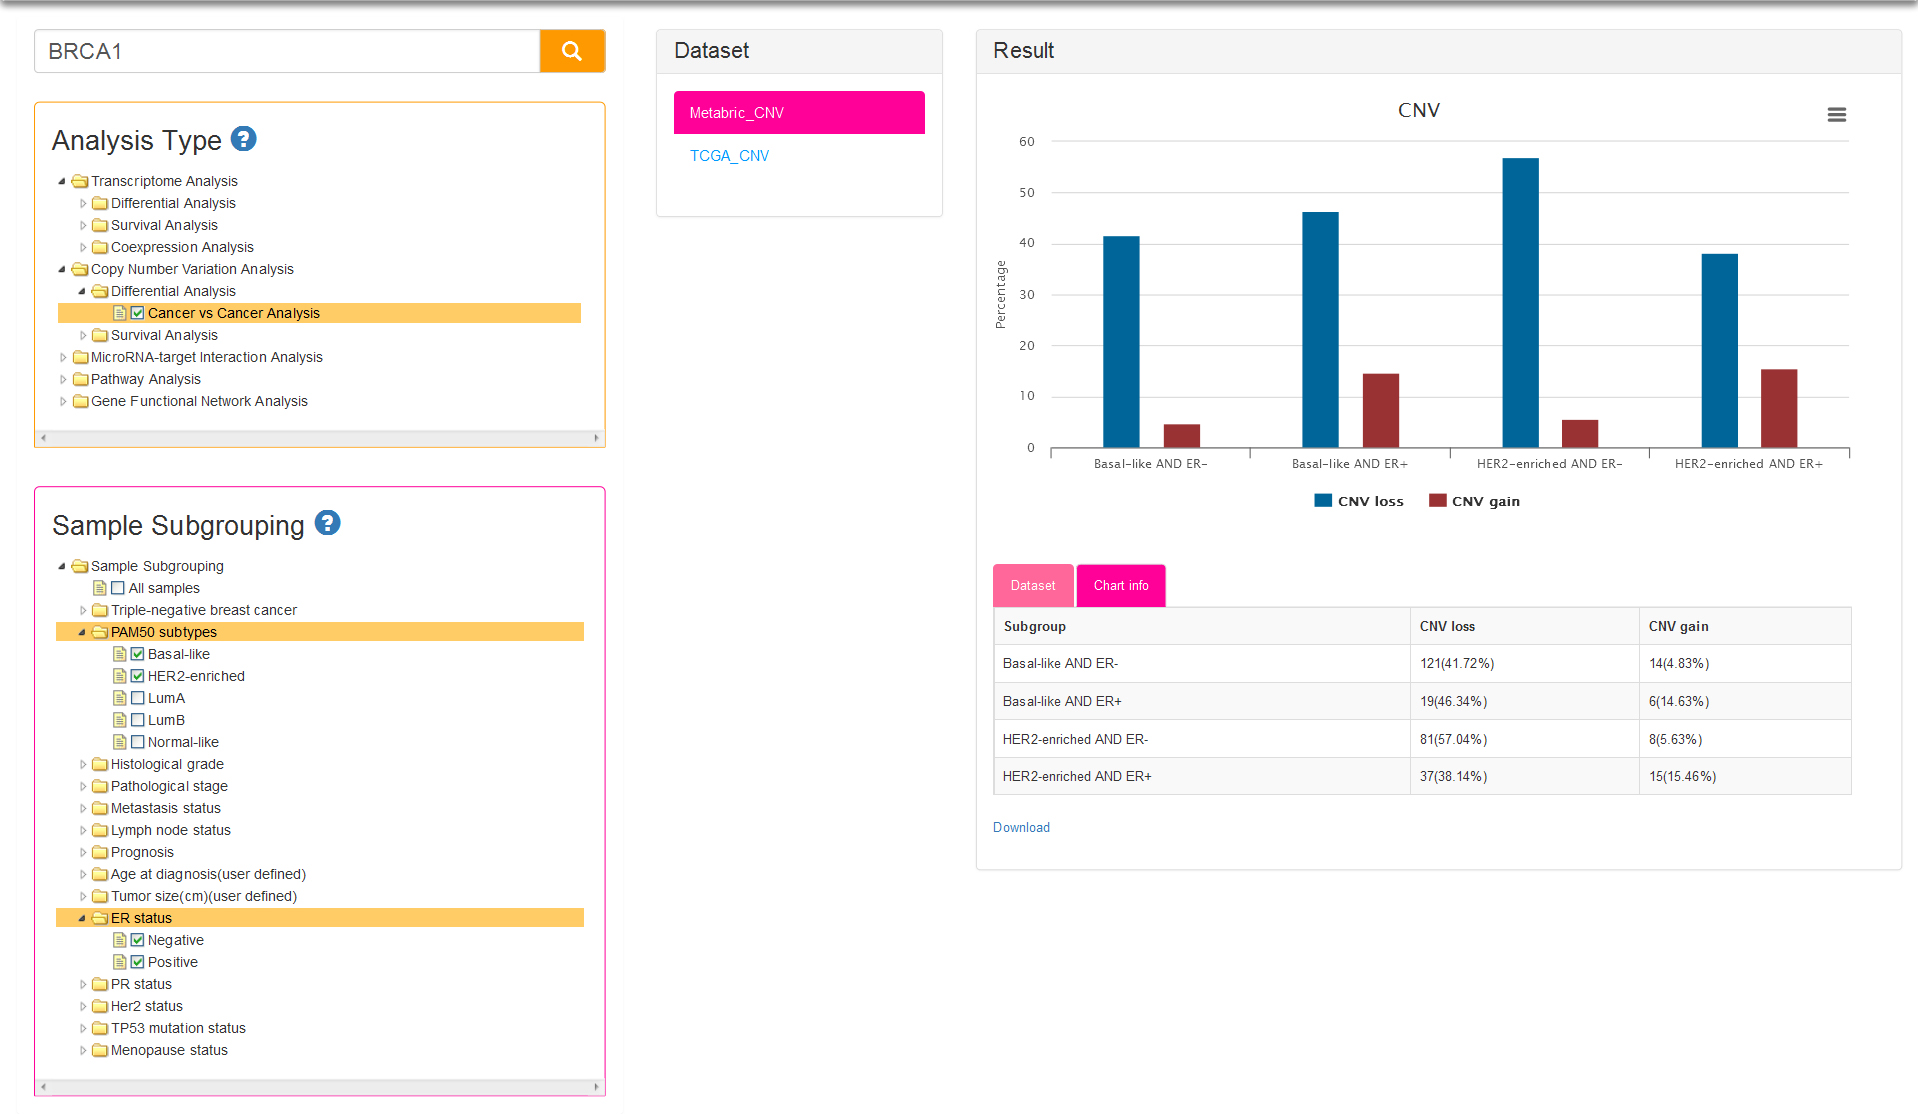
The data of CNV analysis are composed of samples represented as microarray data measuring DNA copy number on tumor samples from Metabric and TCGA.
There is only one analysis type: cancer vs cancer analysis (Fig.7). Sample subgrouping is set to All samples (means all tumor samples in a dataset) by default for current type, which is different from cancer vs cancer option of Transcriptome Analysis (default sample subgrouping option is TNBC and non-TNBC). The samples of the datasets for CNV analysis are firstly divided into two groups: CNV loss group and CNV gain group. The histogram of result column show the difference of CNV status among several subgroups, and the vertical axis represent the percentage of samples with copy number loss/gain in users selected subgroups.
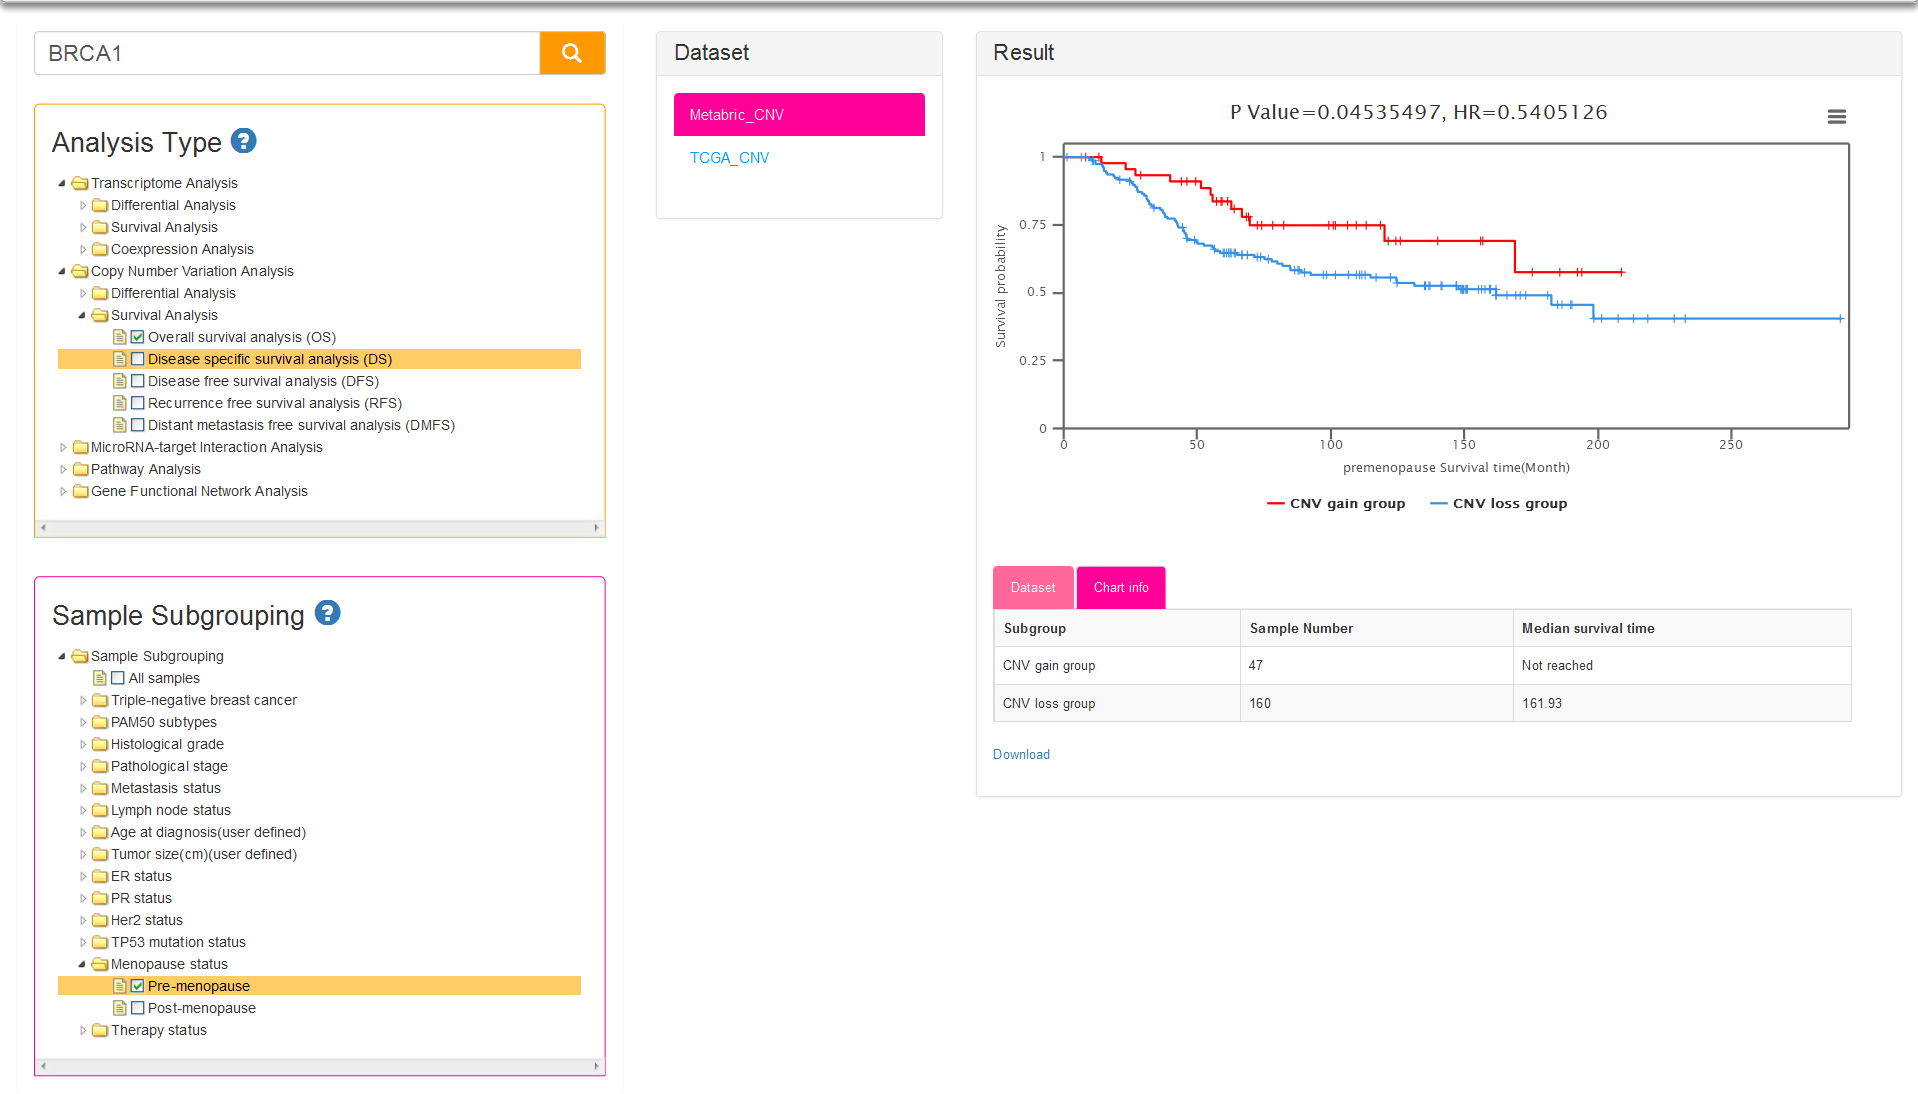
Both the sub-analysis types of CNV-based survival analysis and sample subgrouping methods are same as survival analysis of Transcriptome. The only difference between the two analyses is the result: two survival curves represent low expression group and high expression group respectively for Transcriptome survival, while represent CNV loss group and CNV gain group for CNV survival analysis (Fig.8).
BCIP is designed to provide integrative and flexible gene analysis tools for users who are interested in breast cancer research. There is no doubt that gene based research should not be restricted to analysis of gene itself, instead it needs to attain a profounder and more comprehensive understand of the complex environment and interaction network gene related. In addition to Transcriptome and CNV analyses, therefore, BCIP provides some other functional modules, such as MicroRNA-target Interaction Analysis, Pathway Analysis and Gene Functional Network Analysis.
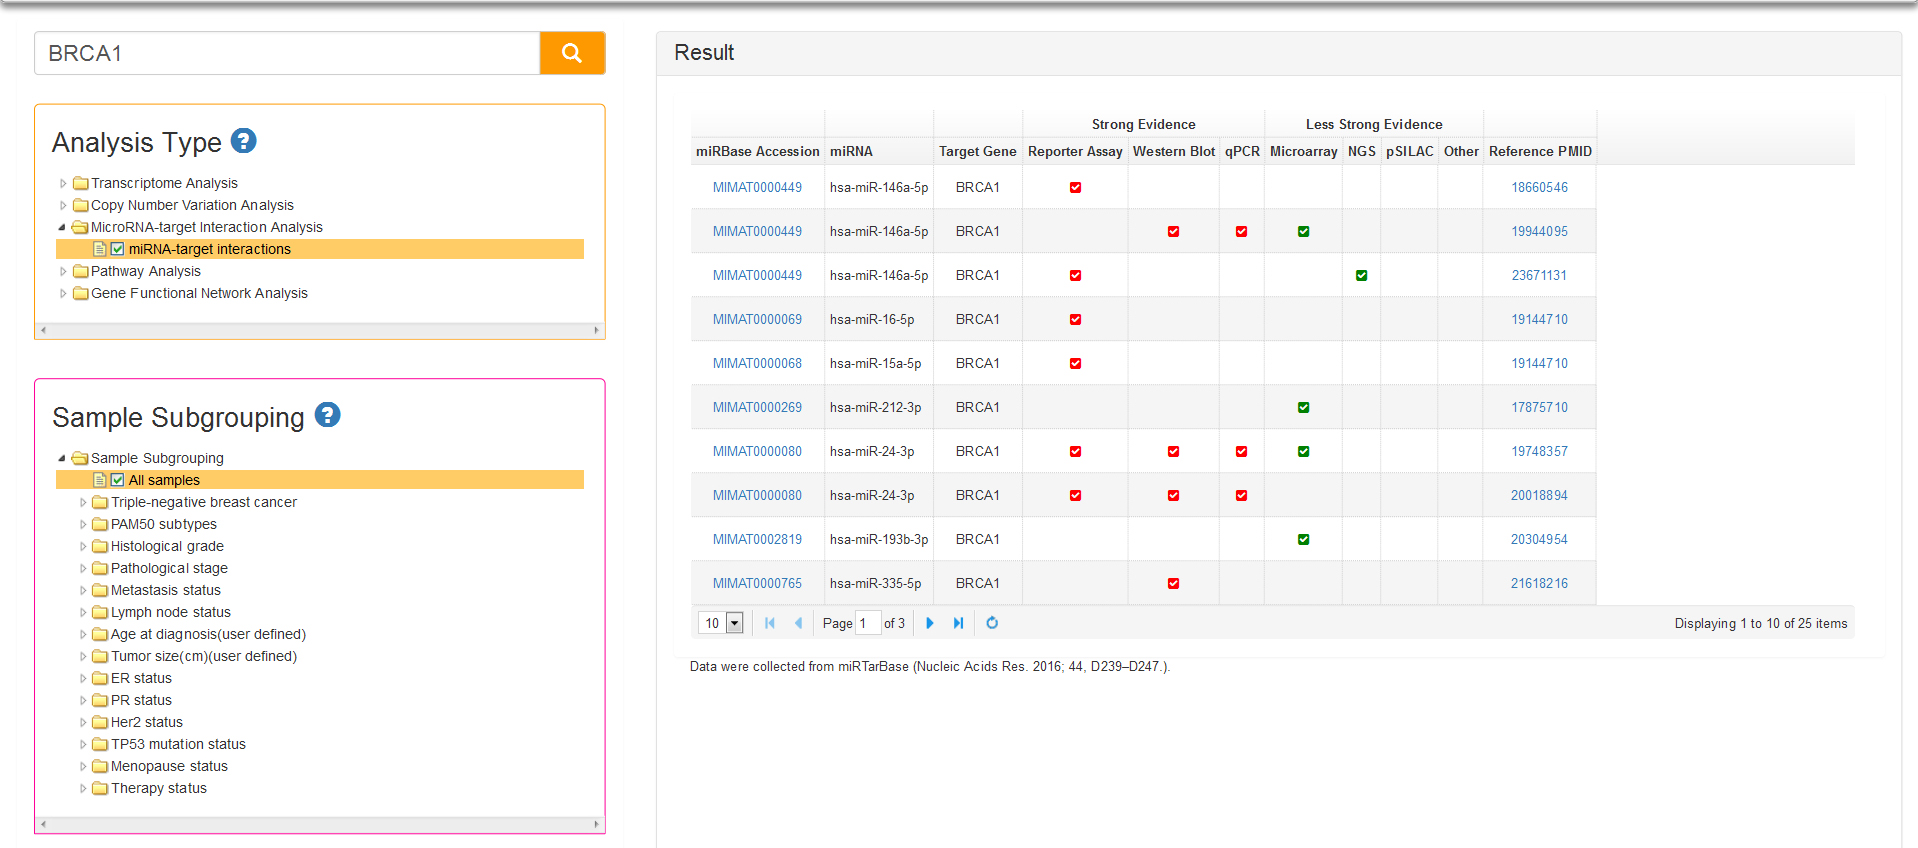
MicroRNAs Analysis with just one analysis type: miRNA-target interactions. The functions of miRNAs appear to be in gene regulation. Human genome may encode thousands of miRNAs, which are abundant in many cell types and appear to target about 60% of protein-coding genes. It is necessary to know about miRNAs which can target the query gene. Data of BCIP about miRNAs are collected from miRTarBase, the experimentally validated microRNA-target interactions database (http://mirtarbase.mbc.nctu.edu.tw/index.php). In result table (Fig.9) we list the mature miRNAs that target query gene and correspondingly certified experiments like reporter assay, western blot, microarray and next-generation sequencing experiments.
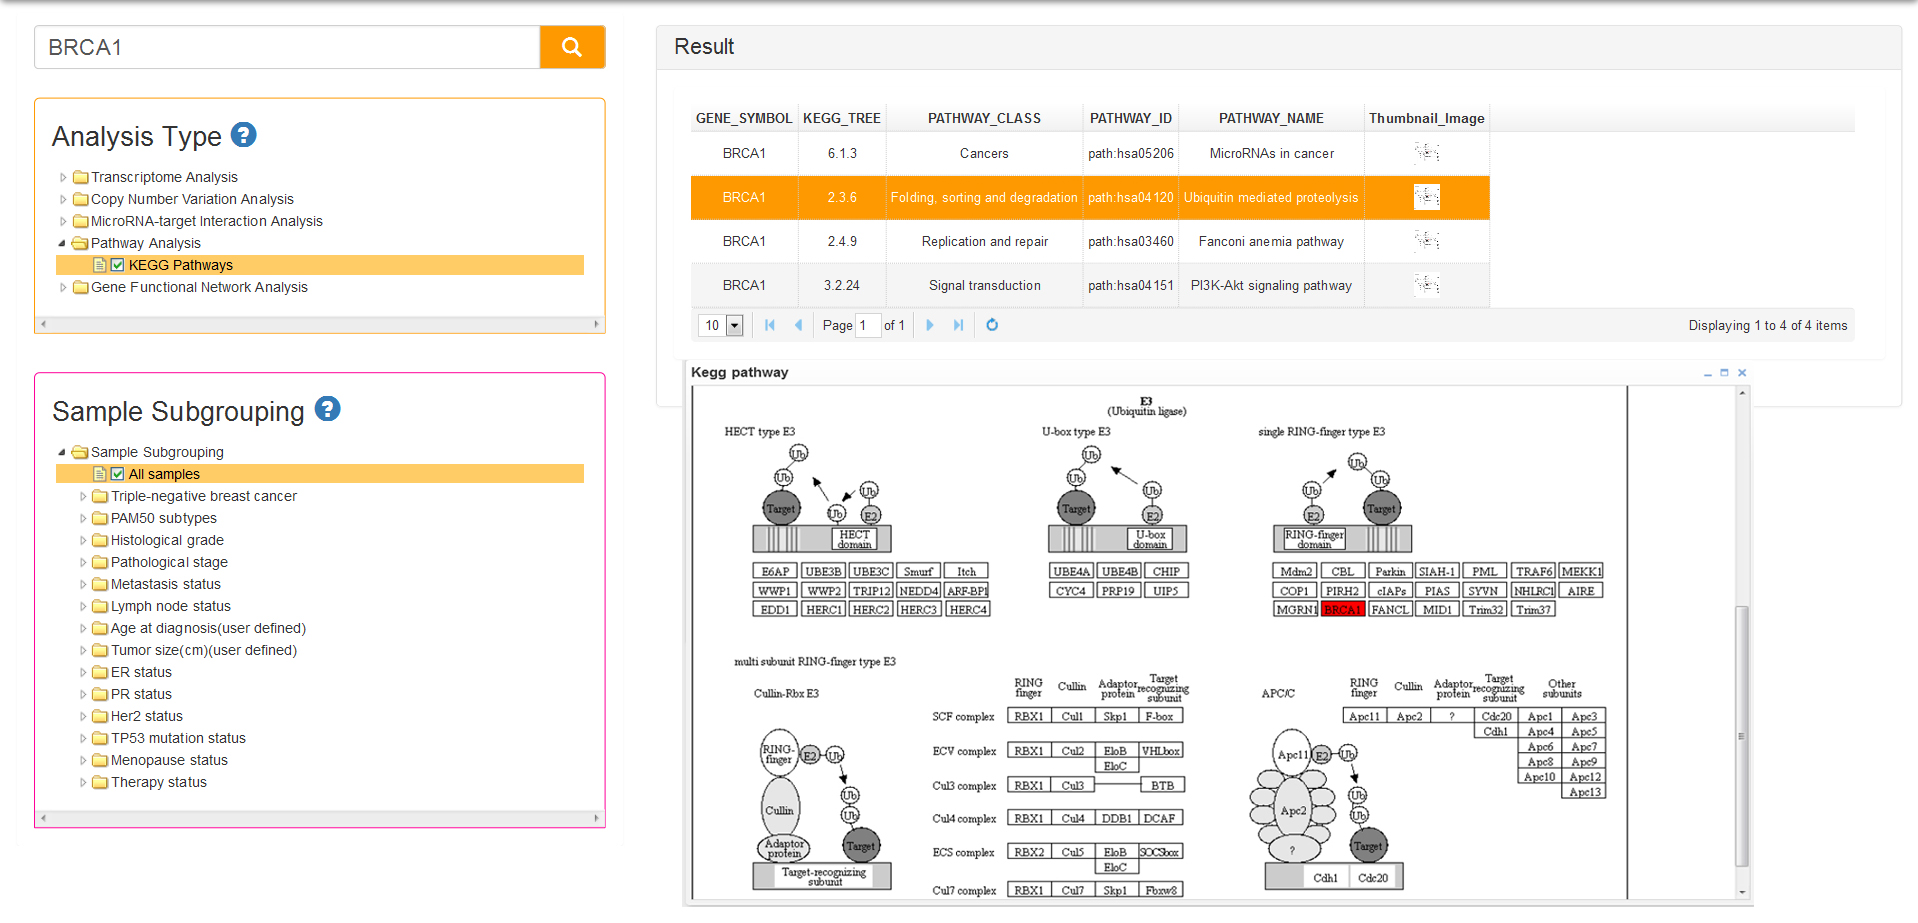
Pathway Analysis also has only one type: KEGG Pathway. A biological pathway is a series of actions among molecules in a cell that leads to a certain product or a change in a cell. Such a pathway can trigger the assembly of new molecules. Pathways can also turn genes on and off, or spur a cell to move. Some of the most common biological pathways are involved in metabolism, the regulation of gene expression and the transmission of signals. Pathways play key role in advanced studies of Genomics.
The result of KEGG pathway analysis list a series of pathways information which are comprised of pathway class, pathway ID and pathway name (Fig 10). The last column of the result table is the thumbnail images that can popup the pathway map when you click on the image. The pathway map, which is generated from pathview package of R, represents molecular interaction and reaction networks about the query gene which is colored red.
Gene network analysis of genome-wide provides a significant tool and landscape for gene function, human health and molecular basics of human disease. More precisely, tissue and cell-type identity lie at the core of human physiology and disease. Genes with tissue-specific expression and function may have key roles in the physiological processes of complex organisms, and such genes are expected to underlie many human diseases. Understanding the genetic underpinnings of complex tissues and individual cell lineages is crucial for developing improved diagnostics and therapeutics. In Gene functional Network Analysis we have provide mammary tissue-specific gene functional network, the data of which are collected from GIANT webserver (http://giant.princeton.edu/) which provides an interface to human tissue-specific networks through multi-gene queries, network visualization, analysis tools and downloadable networks.
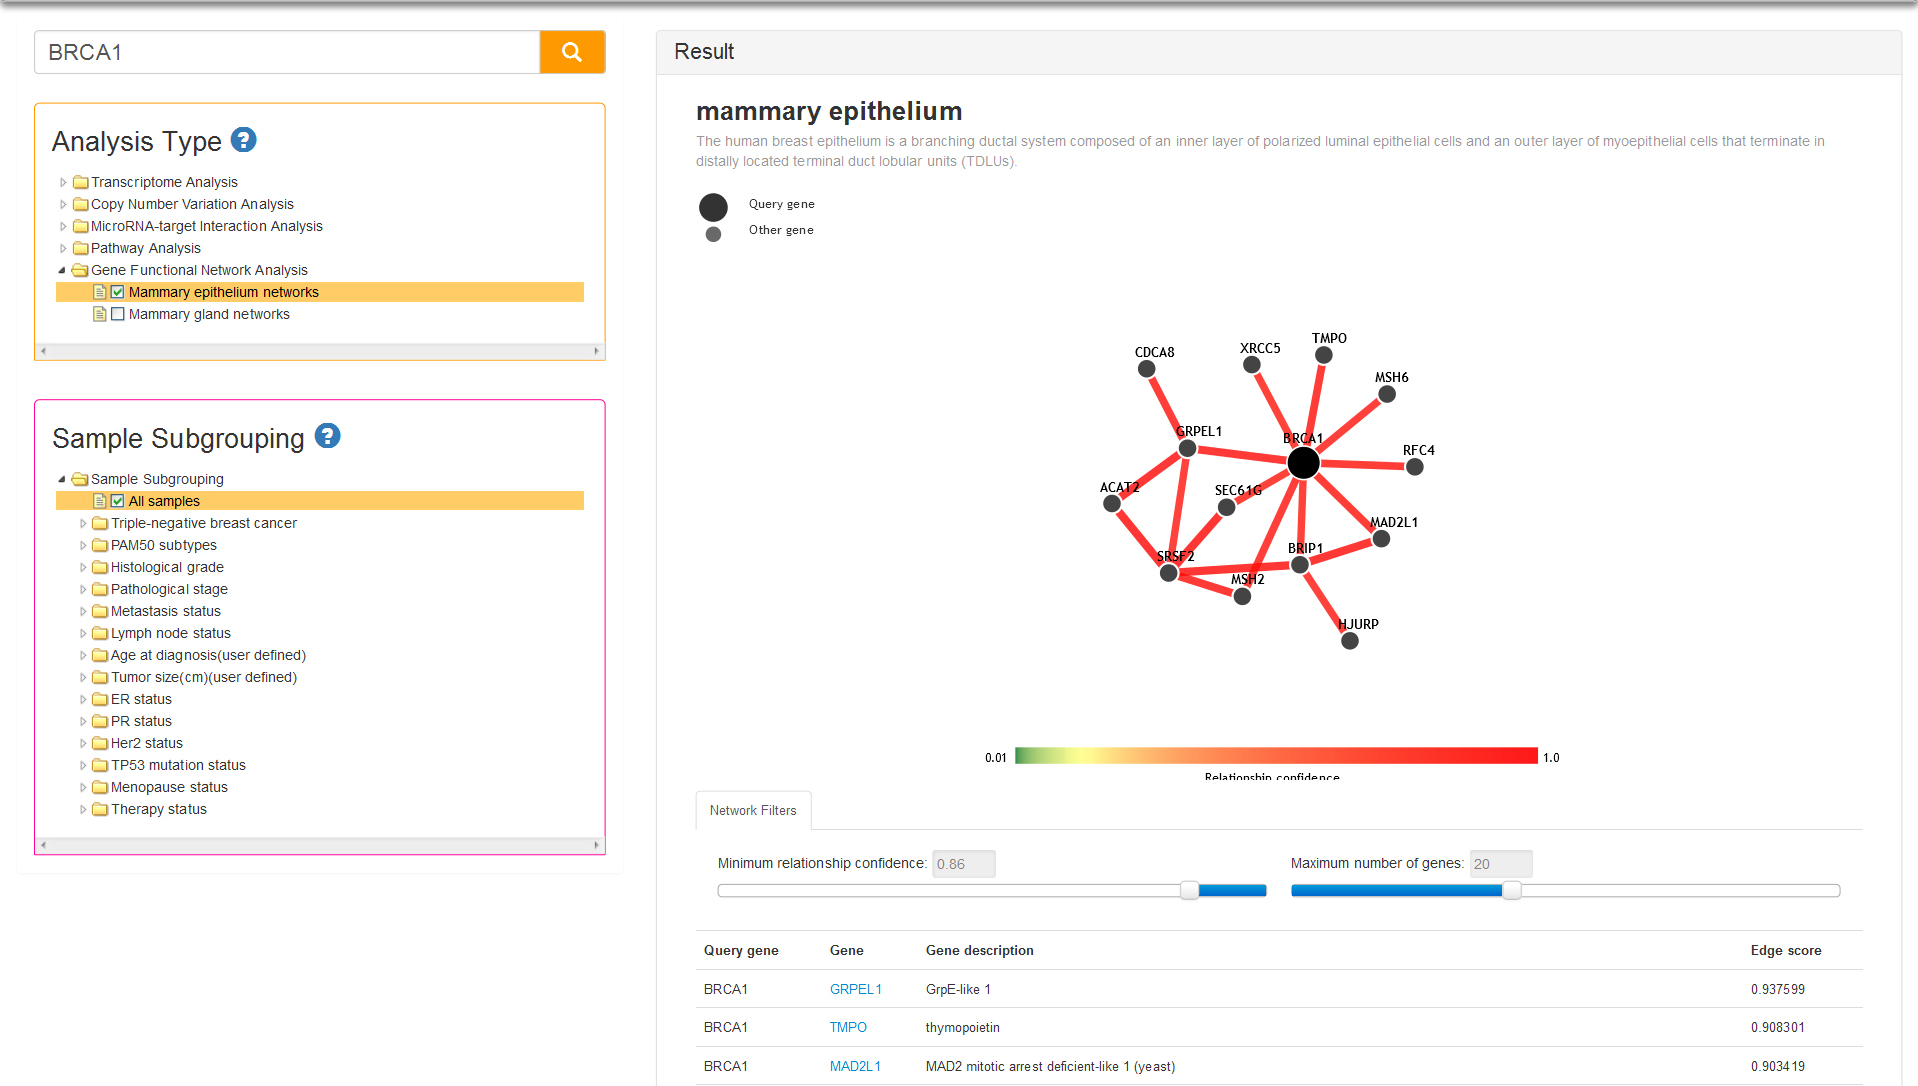
There are two tissue-specific networks provided in current analysis type: mammary epithelium and mammary gland. Both two tissues are critical for gene function analysis for breast cancer, and simultaneously provide tissue-specific functional maps and predictions of tissue-specific gene function. You can select one of the tissues and query your gene, after that the result column will display the network and list of top 50 related genes in accordance with priority of average edge score (Fig 11). You can drag the slider to define minimum relationship confidence and maximum number of genes, thereby changing the network nodes and edges.
Sample subgrouping is the module which provides the function that specimens from each data set are allowed to be divided into several groups on the basis of multiple biological features and clinical data. In this section, we provide a total of 15 options include TNBC or non-TNBC, PAM50 subtype, histological grade and pathological stage, et al. After making a choice among five analytical categories, users can classify samples into several groups according to options laid out in the sample subgrouping module. By this way users can obtain more accurate gene landscape in patients with different pathological phenotypes and molecular features. For example, it has been observed in clinical statistics that some breast cancer patients with larger tumor size have a more favorable survival profiles than those with smaller tumor size. Then users can explore the differential expression or survival status by selecting sample subgrouping features of tumor size option, and define large/small tumor size groups. Notably, there are some slight distinguishes in sample subgrouping rules for different analysis types, and more-specific details are elaborated in Analysis Types section.